![]()
The goal of MS2extract is to provide a tool to create in-house MS/MS libraries that could be used internally, or even better, shared with the community.
This package aids the creation and automatization of in-house MS/MS libraries
This package DOES NOT support algorithms to annotate MS/MS data
Installation
You can install the development version of MS2extract from GitHub with:
# install.packages("devtools")
devtools::install_github("CooperstoneLab/MS2extract")
Example
ppm calculation
with ppm_range() you can compute mass error given a ppm tolerance.
library(MS2extract)
#> Warning in fun(libname, pkgname): mzR has been built against a different Rcpp version (1.0.10)
#> than is installed on your system (1.0.11). This might lead to errors
#> when loading mzR. If you encounter such issues, please send a report,
#> including the output of sessionInfo() to the Bioc support forum at
#> https://support.bioconductor.org/. For details see also
#> https://github.com/sneumann/mzR/wiki/mzR-Rcpp-compiler-linker-issue.
## calculating ppm range
chlorogenic_acid_pos <- 355.1023
ppm_error <- 10
# Calculate ranges
ppm_range(mz = chlorogenic_acid_pos, ppm = ppm_error)
#> [1] 355.0987 355.1059
Importing .mzXML/.mzML files
You can import .mzXML or .mzML files with the import_mzxml() function. This will import MS/MS scans into a data frame. In this case, we are going to work with the procyanidin A2 spectra in negative mode, with a collision energy of 20 eV.
# File path
ProcA2_file <- system.file("extdata",
  "ProcyanidinA2_neg_20eV.mzXML",
  package = "MS2extract"
)
# Compound data
ProcA2_data <- data.frame(Formula = "C30H24O12", Ionization_mode = "Negative")

ProcA2_raw <- import_mzxml(ProcA2_file, ProcA2_data)
#> • Processing: ProcyanidinA2_neg_20eV.mzXML
#> • Found 1 CE value: 20
#> • Remember to match CE velues in spec_metadata when exporting your library
#> • m/z range given 10 ppm: 575.11376 and 575.12526
Extracting the procyanidin A2 spectra
Here, the .mzXML file contains only the MS/MS scans in the retention time window where procyanidin A2 elutes. With the extract_MS2() function, users can detect and extract the most intense MS/MS scan, and displays the TIC indicating which scan is the most intense
ProcA2_ext <- extract_MS2(ProcA2_raw, verbose = TRUE, out_list = FALSE)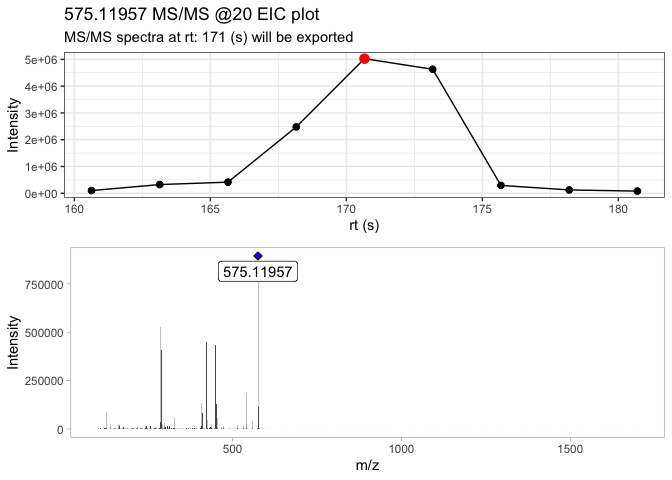
This function returns a list, which contains the MS/MS spectra, and the extracted MS/MS EIC plot. Since the extracted MS/MS spectra contains low intensity signals (i.e. background noise), you can remove them by using the detect_mass() function.
The raw MS2 spectra contains 6226 signals which the majority of them are low intensity signals (background noise).
dim(ProcA2_ext)
#> [1] 6226    6
Detecting masses
The objective is to remove low intensity signals, you can detect masses by allowing normalization by the base peak and then filtering the signals by a minimum threshold, or detecting mass with the absolute signal intensity.
Here, we will detect masses by normalization and with a minimum intensity of 1%
ProcA2_detected <- detect_mass(ProcA2_ext,
  normalize = TRUE, # Allow normalization
  min_int = 1 # 1% as minimum intensity
)

dim(ProcA2_detected)
#> [1] 38  6
Now we can see that the x-axis in the MS/MS spectra is reduced to 575 m/z since the low intensity signals were removed.
plot_MS2spectra(ProcA2_detected)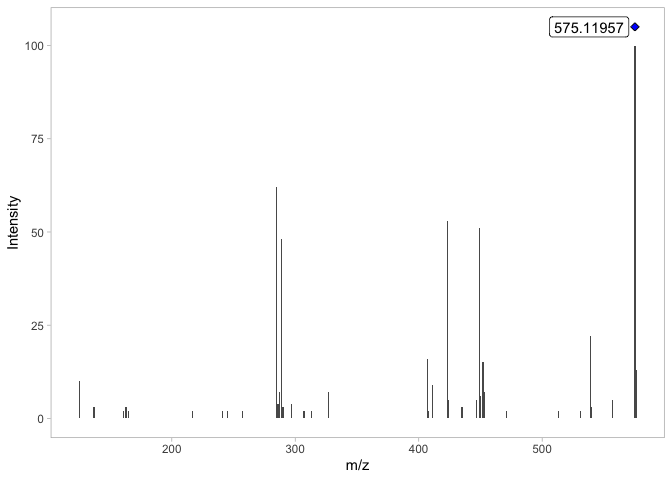
Although the resulting MS/MS spectra contains 38 signals (ions), we are going to include signals with an abundance greater than 10% relative intensity for displaying purposes
dplyr::filter(ProcA2_detected, intensity > 10)
#> # A tibble: 9 × 6
#> # Groups:   Formula, CE [1]
#>      mz intensity mz_precursor    rt    CE Formula
#>   <dbl>     <dbl>        <dbl> <dbl> <dbl> <chr>
#> 1  285.        62         575.  171.    20 C30H24O12
#> 2  289.        48         575.  171.    20 C30H24O12
#> 3  407.        16         575.  171.    20 C30H24O12
#> 4  423.        53         575.  171.    20 C30H24O12
#> 5  449.        51         575.  171.    20 C30H24O12
#> 6  452.        15         575.  171.    20 C30H24O12
#> 7  539.        22         575.  171.    20 C30H24O12
#> 8  575.       100         575.  171.    20 C30H24O12
#> 9  576.        13         575.  171.    20 C30H24O12
Comparing two MS/MS spectra with cosine score
The purpose of this section is to compare two MS/MS spectra that were extracted using this package and using PCDL, a compound library developed by Agilent.
Thus, we include the MS/MS spectra extracted with PCDL and use cosine similarity score to compare them by the compare_spectra() function.
# MS2 PCDL spectra
ProcA2_pcdl_fl <- system.file("extdata",
  "ProcA2_neg_20eV_PCDL.csv",
  package = "MS2extract"
)
# Reading the spectra
ProcA2_PCDL <- read.csv(ProcA2_pcdl_fl)

# Comparing both spectra
compare_spectra(ProcA2_detected, ProcA2_PCDL)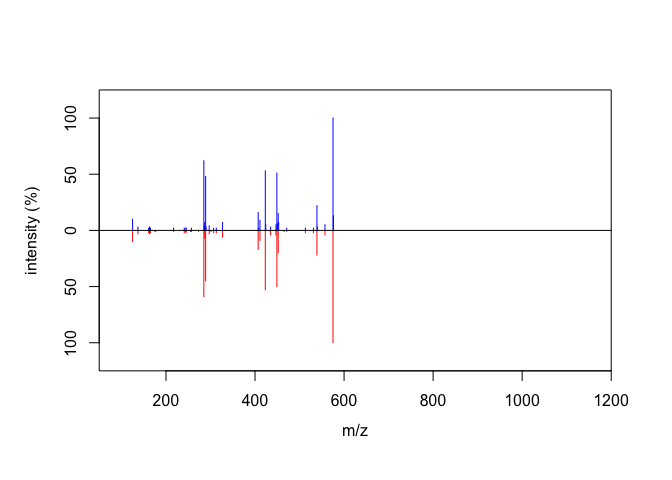
#> $similarity.score
#> [1] 0.9953542
#>
#> $alignment
#>          mz intensity.top intensity.bottom
#> 1  125.0242            10               10
#> 2  285.0405            62               59
#> 3  289.0716            48               45
#> 4  407.0767            16               17
#> 5  423.0720            53               53
#> 6  449.0876            51               50
#> 7  452.0742            15               20
#> 8  539.0978            22               22
#> 9  575.1195           100              100
#> 10 576.1221            13                0
#>
#> $plot
#> gTree[GRID.gTree.160]